

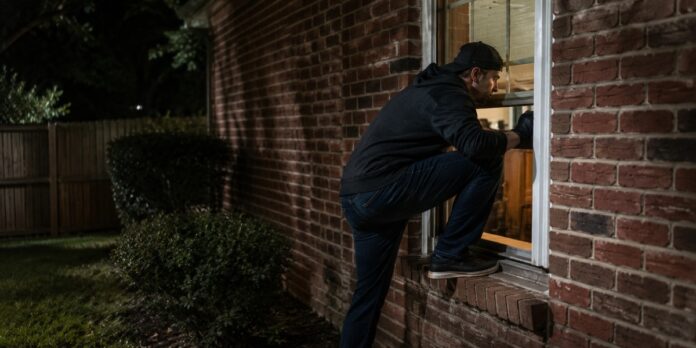
Seagoville recorded 54 burglaries in 2025, nearly half the number reported during a 2022 spike, but still more than the city recorded five years earlier.
If residents judge property crime by headlines about stolen vehicles, shoplifting or packages disappearing from porches, they may miss an important distinction. Burglary and theft are not the same crime.
And when burglary is examined by itself, Seagoville’s five year record tells a more complicated story than simply saying property crime is up or down.
Seagoville Police Department statistics show 44 burglaries in 2020 and 54 in 2025, an increase of 10 offenses, or about 23 percent. But that five year comparison hides a major spike, and a substantial improvement since then.
Seagoville Burglaries by Year
Population Growth Matters
Seagoville has also grown during the period. The city had 18,446 residents in the 2020 Census, while the North Central Texas Council of Governments estimated Seagoville’s population at 20,866 in 2025, population growth of roughly 13 percent.
In other words, population growth explains much of the increase in the raw number of burglaries, but not all of it. The estimated burglary rate was roughly 8 percent higher in 2025 than in 2020.
That means the data does not support a simple conclusion that Seagoville was safer from burglary in 2025 than it was five years earlier. It does support a different conclusion: the city was substantially safer from burglary than it was during the unusual 2022 spike.
Burglary Is Not the Same as Theft
The distinction becomes especially important when comparing burglary with Seagoville’s general theft numbers.
What Counts as Burglary
Under federal crime reporting definitions, burglary involves the unlawful entry of a structure with the intent to commit a felony or theft. Someone does not necessarily have to smash a window or force open a door for an offense to qualify as burglary. A house, apartment, office or other qualifying structure can be burglarized.
What Counts as Theft
Larceny theft is different. It generally involves taking property without the unlawful entry that defines burglary. Shoplifting, bicycle theft, theft of vehicle parts and many other property crimes can fall into the theft category. Motor vehicle theft is reported separately.
| Metric | 2020 | 2025 | Change |
|---|---|---|---|
| Burglary | |||
| Total offenses | 44 | 54 | +23% |
| Rate per 100,000 residents | ~239 | ~259 | +8% |
| Theft | |||
| Total offenses | 226 | 182 | -19% |
| Rate per 100,000 residents | ~1,225 | ~872 | -29% |
That distinction matters because Seagoville’s theft numbers moved in a different direction from burglary. Police recorded 226 theft offenses in 2020. By 2025, the number was 182, a decrease of about 19 percent.
Adjusted for population growth, the change is even larger. The approximate theft rate declined from about 1,225 offenses per 100,000 residents in 2020 to 872 per 100,000 in 2025, a reduction of nearly 29 percent.
So a statement that theft is down does not necessarily mean burglaries are down. In Seagoville’s case, they are not down when the endpoints of 2020 and 2025 are compared.
What the Numbers Cannot Tell Residents
There is another important limitation. The city’s publicly posted summary combines burglaries into one citywide category. It does not show in the same table how many involved homes, apartments, businesses or other structures.
That means the published totals cannot establish whether residential burglaries specifically are declining while business burglaries are increasing, or vice versa. A resident asking, is my house less likely to be burglarized, and a business owner asking the same question about a store are therefore looking at the same overall number. More detailed incident level or NIBRS data would be needed to separate those risks.
The Bottom Line
Seagoville’s burglary picture has improved considerably since 2022, when the city recorded 99 offenses. The 54 burglaries recorded in 2025 were almost half that total.
But residents should be careful about describing the longer term trend as a five year decline. There were 10 more burglaries in 2025 than in 2020, and even after Seagoville’s population growth is considered, the estimated burglary rate was slightly higher. At the same time, ordinary theft moved decidedly downward over the five year period.
Seagoville has made substantial progress from its 2022 burglary spike, and theft overall is lower than five years ago. But when burglary alone is measured from 2020 to 2025, the numbers do not yet show that homes and businesses citywide are safer than they were five years earlier.